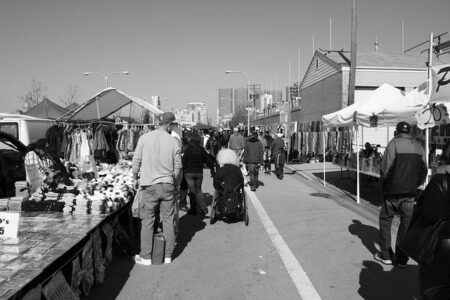

The Bureau of Labor Statistics has released its latest report on consumer expenditures in the Chicago metropolitan area for 2023-24, shedding new light on how households in the region are allocating their spending amid evolving economic conditions. The extensive data, which covers everything from housing and transportation to food and entertainment, offers valuable insights into local consumer behavior and economic trends. As inflationary pressures and shifting market dynamics continue to influence budgets, this report serves as a critical resource for policymakers, businesses, and residents seeking to understand the financial landscape of one of the nation’s largest urban markets.
Consumer Spending Trends Shape Chicago’s Economic Outlook
In recent months, the Chicago metropolitan area has witnessed a notable shift in consumer expenditure patterns, which analysts believe will substantially influence the region’s economic trajectory. Durable goods such as electronics and home appliances have seen a resurgence, reflecting growing consumer confidence despite broader inflationary pressures. Additionally, categories like dining and entertainment have experienced a steady uptick, signaling a willingness among residents to allocate more budget toward lifestyle and leisure activities.
Key trends impacting Chicago’s consumer landscape include:
- Increased online shopping: Digital sales channels are now accounting for over 30% of total retail spending, accelerating a shift away from traditional brick-and-mortar stores.
- Health and wellness: Expenditures on fitness memberships and organic groceries rose by approximately 15% compared to last year.
- Transportation costs: Consumers are adjusting budgets as fuel prices stabilize, with more investment in public transportation passes and ride-sharing services.
| Spending Category | Growth Rate (2023-24) | Share of Total Expenditure |
|---|---|---|
| Electronics & Appliances | +8.5% | 14% |
| Dining & Entertainment | +6.2% | 12% |
| Online Retail | +11.4% | 31% |
| Health & Wellness | +15.0% | 9% |
Housing Costs Dominate Household Budgets in the Chicago Metro Area
In the Chicago metropolitan area, housing expenses remain the single largest financial commitment for most households, accounting for nearly 35% of total consumer expenditures in 2023-24. This percentage significantly surpasses other major spending categories such as transportation and food,reflecting rising rents,mortgage payments,and utility costs compounded by ongoing urban growth and market pressures. Analysts note that even modest increases in housing prices have an outsized impact on household budgets, particularly for middle- and lower-income families.
Key factors influencing these costs include:
- Rental Market Pressures: Vacancy rates have shrunk to historic lows, pushing rents upward across the city and suburbs.
- Utility Price Volatility: Energy and water bills have experienced sharp seasonal spikes, affecting overall affordability.
- Interest Rate Effects: Elevated mortgage rates have increased monthly housing payments for many homeowners with variable loans.
| Spending Category | Average Monthly Expenditure | Percentage of Total Budget |
|---|---|---|
| Housing | $1,200 | 34.7% |
| Transportation | $600 | 17.3% |
| Food | $450 | 13.0% |
Rising Transportation Expenses Challenge Commuters and City Planners
The surge in transportation expenses is placing significant strain on daily commuters across the Chicago metropolitan area, compelling residents to rethink their travel habits. Rising fuel prices, increased public transit fares, and maintenance costs for personal vehicles have contributed to a noticeable uptick in monthly spending. For many families, transportation now represents a larger slice of their budget pie, forcing tough choices between convenience, affordability, and time efficiency.
City planners face a dual challenge: accommodating the growing demand for affordable transportation options while maintaining infrastructure in a fiscally responsible way. Several initiatives are under consideration to alleviate the pressure, including:
- Expanded subsidized transit programs aimed at low-income workers.
- Investment in bike lanes and pedestrian-amiable routes to encourage option commuting.
- Enhanced ride-sharing services supported by public-private partnerships.
| Mode | Avg. Monthly Cost | Year-over-Year Increase |
|---|---|---|
| Personal Vehicle | $420 | 8% |
| Public Transit | $110 | 6% |
| Ride-sharing | $160 | 12% |
Recommendations for Managing Inflation Impact on Local Consumer Spending
To safeguard household budgets in the face of rising prices, consumers are encouraged to adopt proactive financial habits that minimize the erosion of purchasing power. Prioritizing essential goods and services, while delaying non-urgent purchases, can help maintain spending within lasting limits. Additionally, leveraging available discount programs and loyalty incentives offered by local retailers can stretch dollars further, counteracting inflationary pressures.
Key strategies include:
- Tracking monthly expenses with budgeting apps specially tailored to Chicago-area consumers
- Choosing seasonal and locally-produced items to reduce cost volatility
- Exploring community markets and bulk-buying options to access lower prices
- Substituting premium brands with equally effective alternatives
| Expense Category | Inflation Impact | Suggested Consumer Action |
|---|---|---|
| Groceries | High | Buy in bulk, use coupons |
| Transportation | Moderate | Utilize public transit |
| Utilities | Low | Implement energy-saving methods |
Final Thoughts
the latest Consumer Expenditures report from the Bureau of Labor Statistics offers a detailed snapshot of spending patterns across the Chicago Metropolitan Area for 2023-24.As residents navigate evolving economic conditions, these insights provide valuable context for policymakers, businesses, and consumers alike. Monitoring these trends will be essential in understanding how the region’s economic landscape continues to shift in the year ahead.